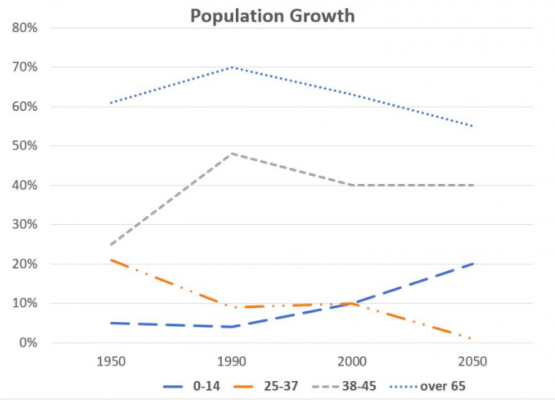
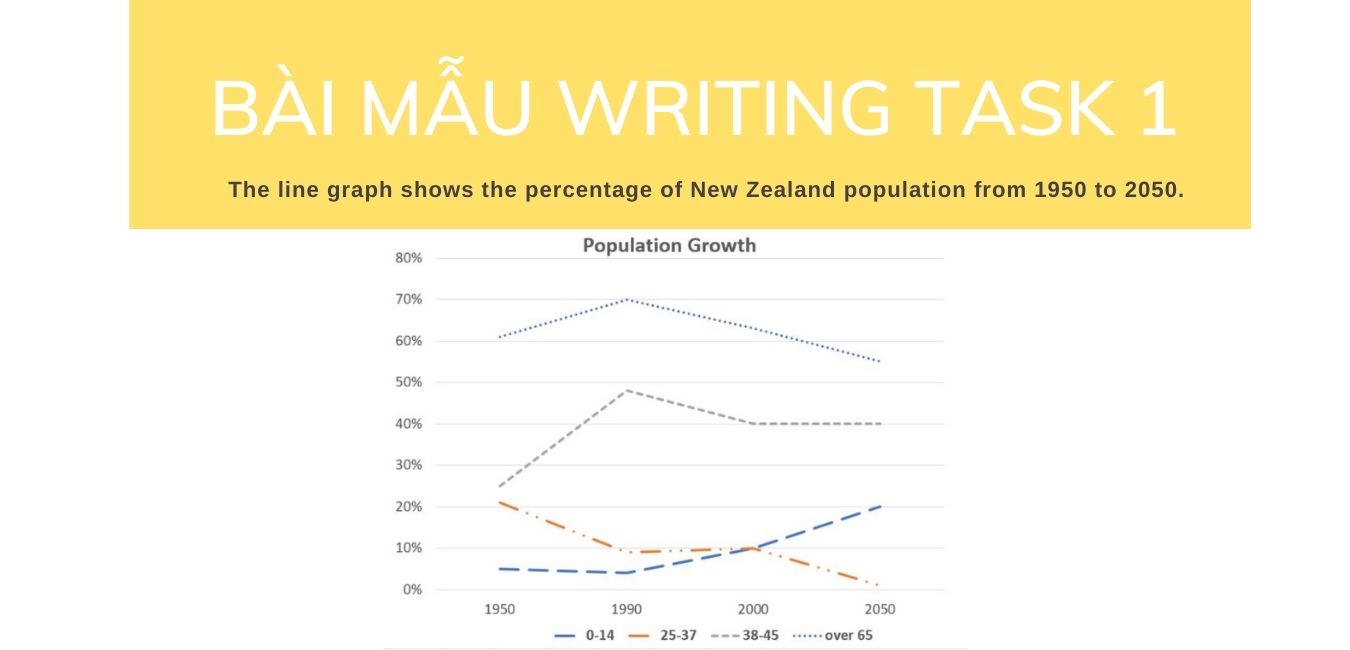
The line graph shows the percentage of New Zealand population from 1950 to 2050.
(Biểu đồ đường thể hiện số phần trăm của dân số New Zealand từ năm 1950 đến 2050)
Download và tải bản PDF TẠI ĐÂY
Tham khảo:
Bài mẫu IELTS Writing Task 1 ngày 21/05/2020 – Internet usage

Contents
Hướng dẫn cách viết bài
Phân tích đề
- Topic: Population
- Keywords: percentage, population
- Dạng bài: Biểu đồ đường, số phần trăm
Cách viết mở bài

The line graph indicates how the demographic structure of New Zealand changes from 1950 and estimations until 2050.
Cách viết tổng quan

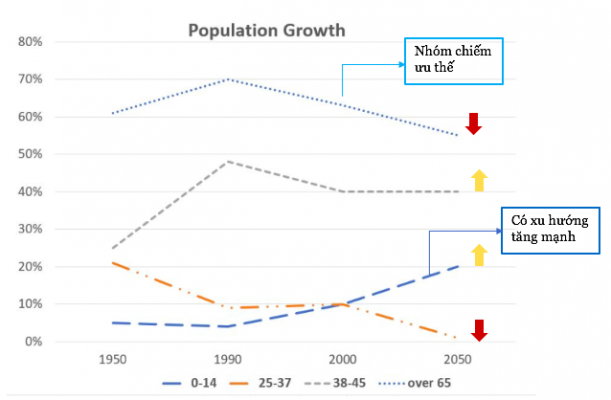
Overall, it can be easily seen that those aged 65 or plus account for the highest percentage of the population.
Cách viết thân bài

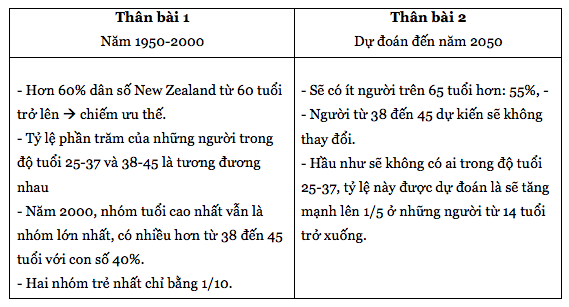
In 1950, over 60% of New Zealand’s population were aged 60 or older, being the predominant age group. While the percentages of those aged 25-37 and 38-45 were similar, at a quarter each, only 5% of people living in New Zealand were 14 years old or younger. Over the next 50 years, the most senior age group still remained as the largest group, there were more 38-to-45 year-olds with the figure of 40%. Meanwhile, the data of two youngest groups were equal at one tenth.
By 2050, estimations reveal that there will be fewer people aged over 65 years old, at roughly 55%, while the data of those from 38 to 45 is expected to remain unchanged. While it is forecasted that there will be almost no one in the 25-37 age group, a drastic increase to a fifth is foreseen in the proportion of those aged 14 or younger.
Bài mẫu hoàn chỉnh
The line graph indicates how the demographic structure of New Zealand changes from 1950 and estimations until 2050.
Overall, it can be easily seen that those aged 65 or plus account for the highest percentage of the population.
In 1950, over 60% of New Zealand’s population were aged 60 or older, being the predominant age group. While the percentages of those aged 25-37 and 38-45 were similar, at a quarter each, only 5% of people living in New Zealand were 14 years old or younger. Over the next 50 years, the most senior age group still remained as the largest group, there were more 38-to-45 year-olds with the figure of 40%. Meanwhile, the data of two youngest groups were equal at one tenth.
By 2050, estimations reveal that there will be fewer people aged over 65 years old, at roughly 55%, while the data of those from 38 to 45 is expected to remain unchanged. While it is forecasted that there will be almost no one in the 25-37 age group, a drastic increase to a fifth is foreseen in the proportion of those aged 14 or younger.
(188 words)
Written by Ms Thu Huong Nguyen – IELTS 8.0
Paraphrase keywords
- the percentage of = the proportion of = the data of = the figure for
- to estimate = to forecast
- population = demographic structure
Các từ vựng hay trong bài
- the demographic structure: dân số
- be predominant: nổi bật, chiếm ưu thế
- senior age group: nhóm tuổi già nhất
- to reveal: tiết lộ
Bài dịch
Biểu đồ đường cho biết dân số của New Zealand thay đổi như thế nào từ năm 1950 và ước tính cho đến năm 2050.
Nhìn chung, có thể dễ dàng nhận thấy rằng những người từ 65 tuổi trở lên chiếm tỷ lệ cao nhất trong dân số.
Vào năm 1950, hơn 60% dân số New Zealand từ 60 tuổi trở lên, là nhóm tuổi chiếm ưu thế. Trong khi tỷ lệ phần trăm của những người trong độ tuổi 25-37 và 38-45 là tương đương nhau, với 1/4, chỉ có 5% người sống ở New Zealand từ 14 tuổi trở xuống. Trong 50 năm tiếp theo, nhóm tuổi cao nhất vẫn là nhóm lớn nhất, có nhiều hơn từ 38 đến 45 tuổi với con số 40%. Trong khi đó, số liệu của hai nhóm trẻ nhất chỉ bằng 1/10.
Đến năm 2050, các ước tính cho thấy sẽ có ít người trên 65 tuổi hơn, khoảng 55%, trong khi dữ liệu của những người từ 38 đến 45 dự kiến sẽ không thay đổi. Trong khi người ta dự báo rằng hầu như sẽ không có ai trong độ tuổi 25-37, tỷ lệ này được dự đoán là sẽ tăng mạnh lên 1/5 ở những người từ 14 tuổi trở xuống.

