Dưới đây là bài mẫu và phân tích chi tiết cho bài IELTS Writing Task 1 chủ đề People working in different sectors
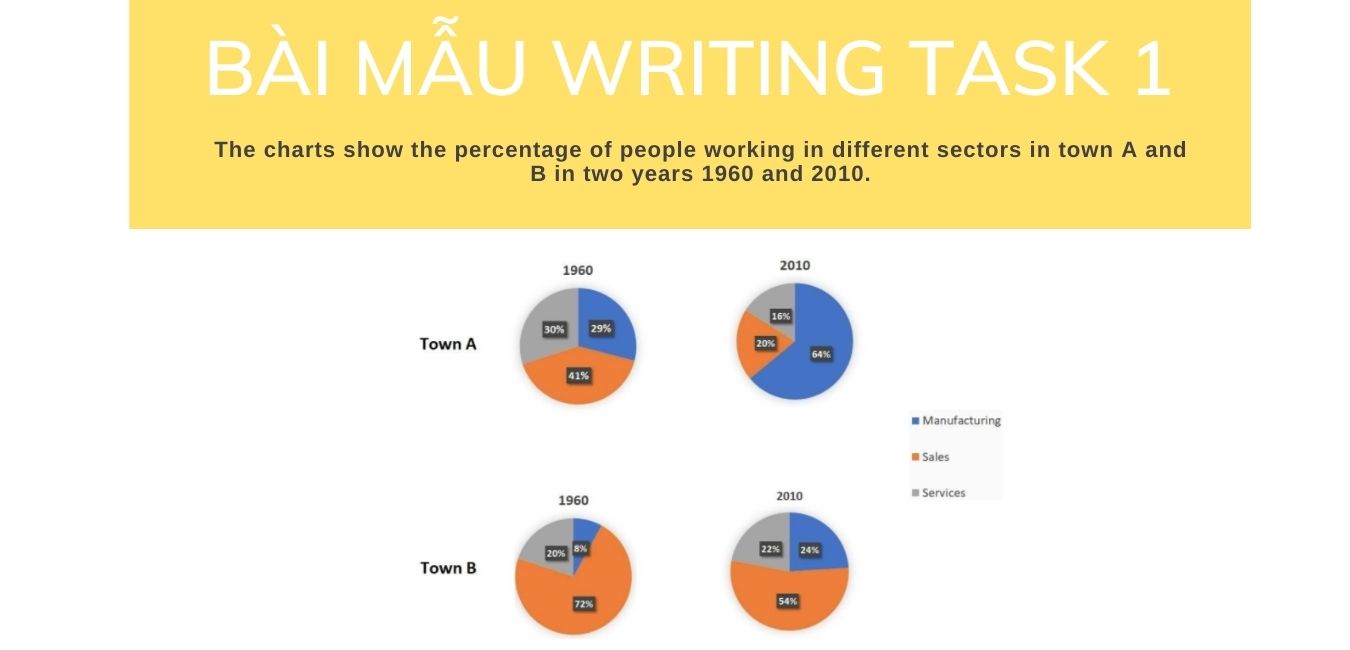
The charts show the percentage of people working in different sectors in town A and B in two years 1960 and 2010.
(Biểu đồ thể hiện số phần trăm người làm việc trong những lĩnh vực khác nhau tại thị trấn A và B trong 2 năm 1960 và 2010)
Download và tải bản PDF People working in different sectors TẠI ĐÂY
Tham khảo

Contents
Hướng dẫn cách viết bài
Phân tích đề
- Topic: People working in different sectors
- Keywords: working, percentage, different sectors
- Dạng bài: Biểu đồ tròn, số phần trăm
Cách viết mở bài

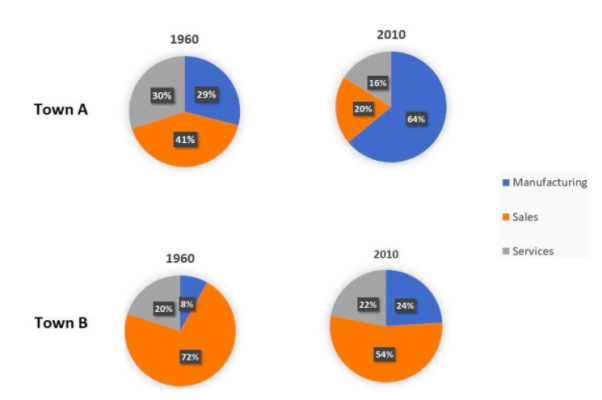
The four pie charts indicate how many people in town A and B worked in three distinct areas in 1960 and 2010.
Cách viết tổng quan

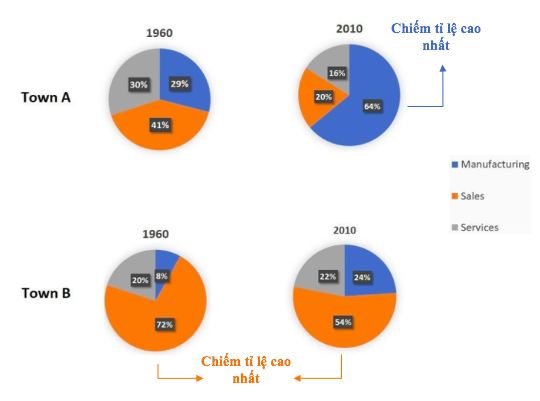
Overall, it can be easily seen that a significant percentage of people in town A were employed in manufacturing. In town B, sales accounted for the highest proportion of the workforce.
Cách viết thân bài

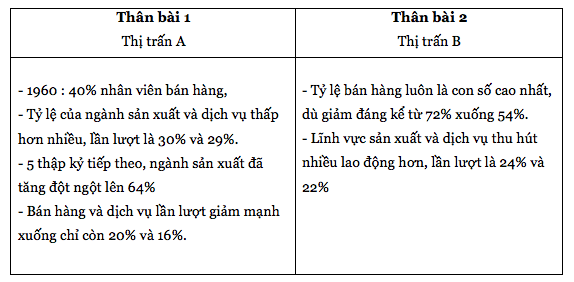
With regard to town A, in 1960, 40% of the employees had sales-related jobs, while the proportions of manufacturing and services were much lower, at 30% and 29% respectively. However, in the following 5 decades, there was abrupt growth in the data of manufacturing to 64%, being the most popular industry, while employment in sales and services witnessed drastic declines to merely 20% and 16% in turn.
Turning to town B, employment in sales had always been the highest figure, despite a significant drop from 72% to 54%. In contrast, manufacturing and services attracted more percentage of employees, at 24% and 22% over the period surveyed.
Bài mẫu hoàn chỉnh – People working in different sectors.
The four pie charts indicate how many people in town A and B worked in three distinct areas in 1960 and 2010.
Overall, it can be easily seen that a significant percentage of people in town A were employed in manufacturing. In town B, sales accounted for the highest proportion of the workforce.
With regard to town A, in 1960, 40% of the employees had sales-related jobs, while the proportions of manufacturing and services were much lower, at 30% and 29% respectively. However, in the following 5 decades, there was abrupt growth in the data of manufacturing to 64%, being the most popular industry, while employment in sales and services witnessed drastic declines to merely 20% and 16% in turn.
Turning to town B, employment in sales had always been the highest figure, despite a significant drop from 72% to 54%. In contrast, manufacturing and services attracted more percentage of employees, at 24% and 22% over the period surveyed.
(159 words)
Written by Ms. Thu Huong Nguyen – IELTS 8.0
Paraphrase keywords
- to show = to indicate
- different sectors = distinct areas
- the percentage of = the proportions of
Các từ vựng hay trong bài
- be significant: rõ ràng, nổi bật
- to account for: đại diện cho
- drastic decline: suy giảm nghiêm trọng
- abrupt growth: tăng trưởng đột ngột
Bài dịch
Bốn biểu đồ hình tròn cho biết có bao nhiêu người ở thị trấn A và B đã làm việc ở ba lĩnh vực riêng biệt trong năm 1960 và 2010.
Nhìn chung, có thể dễ dàng nhận thấy rằng một tỷ lệ đáng kể người dân ở thị trấn A đã làm việc trong lĩnh vực sản xuất. Ở thị trấn B, lĩnh vực bán hàng chiếm tỷ lệ cao nhất trong lực lượng lao động.
Đối với thị trấn A, vào năm 1960, 40% nhân viên có công việc liên quan đến bán hàng, trong khi tỷ lệ của ngành sản xuất và dịch vụ thấp hơn nhiều, lần lượt là 30% và 29%. Tuy nhiên, trong 5 thập kỷ sau đó, số liệu của ngành sản xuất đã tăng đột ngột lên 64%, là ngành phổ biến nhất, trong khi việc làm trong bán hàng và dịch vụ lần lượt giảm mạnh xuống chỉ còn 20% và 16%.
Chuyển sang thị trấn B, việc làm trong lĩnh vực bán hàng luôn là con số cao nhất, mặc dù đã giảm đáng kể từ 72% xuống 54%. Ngược lại, lĩnh vực sản xuất và dịch vụ thu hút nhiều lao động hơn, lần lượt là 24% và 22% trong giai đoạn khảo sát.
Trong quá trình sử dụng tài liệu của SYM, bạn cần hỗ trợ bạn có thể liên hệ Fanpage SYM English để nhận hỗ trợ nhanh nhất từ SYM.
Để tải thêm nhiều tài liệu học IELTS các bạn vào Group Facebook để tải!
Đăng ký kênh youtube : https://bit.ly/dang-ky-kenh-SYM để xem nhiều video có ích giúp bạn tăng band điểm.
SYM English chúc bạn học IELTS thật tốt với bài mẫu People working in different sectors
Ms. Nguyen Thi Thu Huong, IELTS 8.0..

