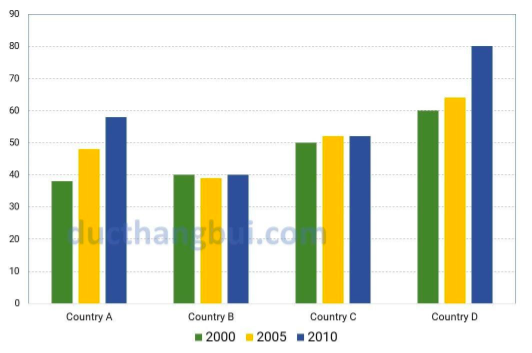
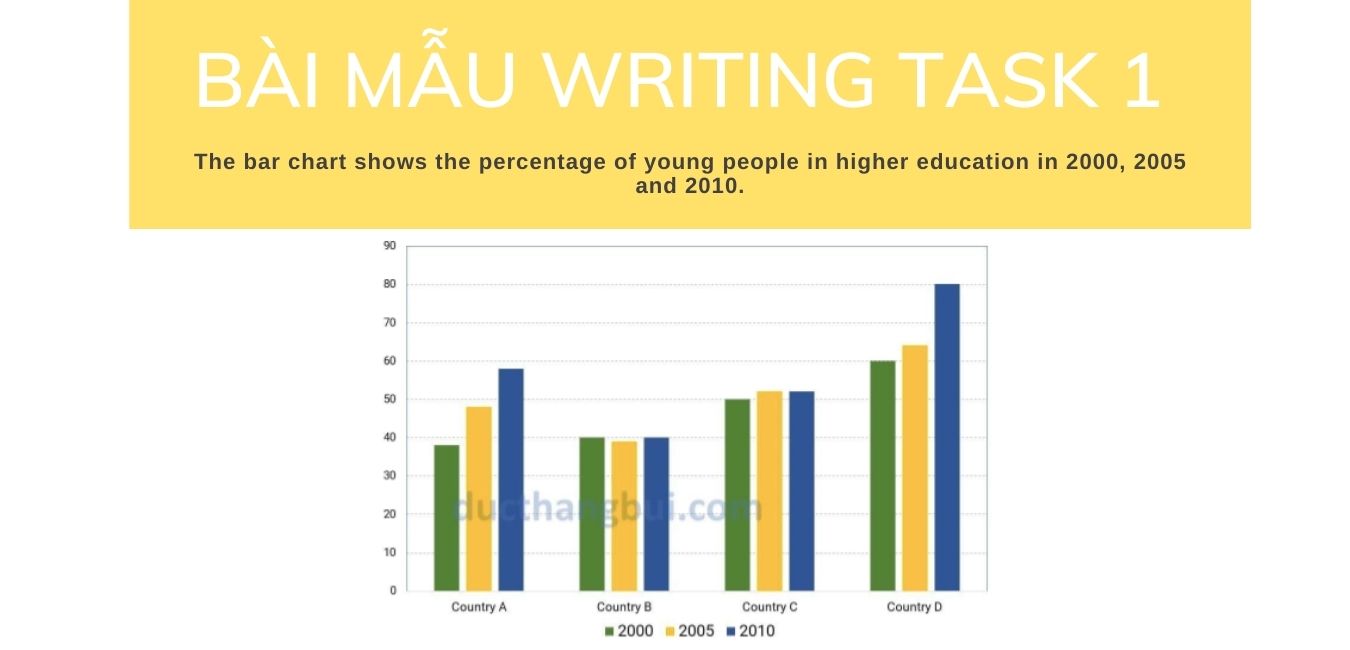
The bar chart shows the percentage of young people in higher education in 2000, 2005 and 2010.
(Biểu đồ cột thể hiện số phần trăm của những người trẻ học đại học vào năm 2000, 2005 và 2010)
Download và tải bản PDF TẠI ĐÂY
Tham khảo:

Nguồn hình ảnh: ducthangbui.com
Contents
Hướng dẫn viết bài
Phân tích đề
- Topic: higher education
- Keywords: percentage, young people, higher education
- Dạng bài: Phân tích biểu đồ cột, số phần trăm
Cách viết mở bài

The bar chart indicates the percentage of young people who entered tertiary education in four distinct nations between 2000 and 2010.
Cách viết tổng quan

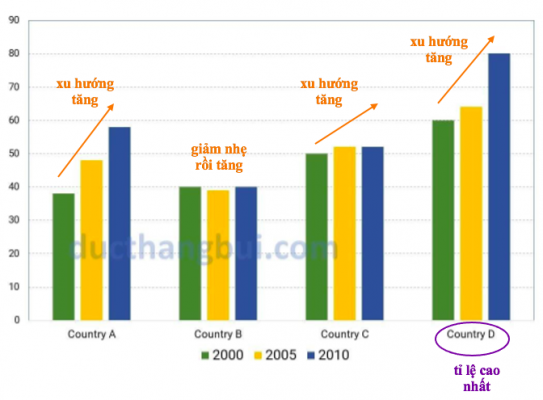
Overall, it can be easily seen that the participation rate of young people attending higher education was on the rise, with the exception of country B. Another notable feature is that country D had by far the highest proportion of young people entering higher education.
Cách viết thân bài

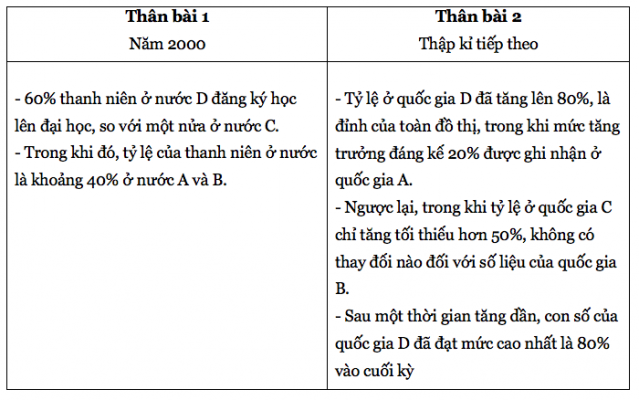
In 2000, 60% of young people in country D signed up for a course at higher education, compared to half of the young population in country C. Meanwhile, there were relatively similar proportions of approximately 40% higher education attendance among young people in countries A and B.
Over the following decade, the participation rate in country D soared to 80%, being the peak of the whole graph, while a remarkable growth of 20% was recorded in country A. In contrast, while the percentage of young people participating in higher education in country C just grew minimally to over a half, there were no changes to the data of country B. After a period of gradual increase, the figure for country D reached a peak of 80% at the end of the period.
Bài mẫu hoàn chỉnh
The bar chart indicates the percentage of young people who entered tertiary education in four distinct nations between 2000 and 2010.
Overall, it can be easily seen that the participation rate of young people attending higher education was on the rise, with the exception of country B. Another notable feature is that country D had by far the highest proportion of young people entering higher education.
In 2000, 60% of young people in country D signed up for a course at higher education, compared to half of the young population in country C. Meanwhile, there were relatively similar proportions of approximately 40% higher education attendance among young people in countries A and B.
Over the following decade, the participation rate in country D soared to 80%, being the peak of the whole graph, while a remarkable growth of 20% was recorded in country A. In contrast, while the percentage of young people participating in higher education in country C just grew minimally to over a half, there were no changes to the data of country B. After a period of gradual increase, the figure for country D reached a peak of 80% at the end of the period.
(197 words)
Written by Ms Thu Huong Nguyen – IELTS 8.0
Paraphrase keywords
- percentage = proportion
- higher education = tertiary education
- to show = to indicate
Các từ vựng hay trong bài
- the exception of : ngoại lệ
- to sign up: đăng kí
- the peak of : đỉnh, điểm cao nhất
- a remarkable growth: sự tăng trưởng đáng kể
- to grow minimally: tăng rất nhẹ
Bài dịch
Biểu đồ thanh cho biết tỷ lệ phần trăm số người vào học đại học ở bốn quốc gia khác nhau trong khoảng thời gian từ năm 2000 đến 2010.
Nhìn chung, có thể dễ dàng nhận thấy rằng tỷ lệ tham gia học đại học của thanh niên đang tăng lên, ngoại trừ quốc gia B. Một đặc điểm đáng chú ý nữa là quốc gia D có tỷ lệ thanh niên đi học đại học cao nhất từ trước đến nay.
Năm 2000, 60% thanh niên ở nước D đăng ký học lên đại học, so với một nửa dân số trẻ ở nước C. Trong khi đó, tỷ lệ đi học đại học tương tự của thanh niên ở nước A là khoảng 40%. và B.
Trong thập kỷ tiếp theo, tỷ lệ tham gia ở quốc gia D đã tăng lên 80%, là đỉnh của toàn đồ thị, trong khi mức tăng trưởng đáng kể 20% được ghi nhận ở quốc gia A. Ngược lại, trong khi tỷ lệ thanh niên tham gia giáo dục đại học ở quốc gia C chỉ tăng tối thiểu hơn 50%, không có thay đổi nào đối với số liệu của quốc gia B. Sau một thời gian tăng dần, con số của quốc gia D đã đạt mức cao nhất là 80% vào cuối kỳ.

